EIA Reports Draw On Crude Oil Stocks
As a general trading rule, pricing GAPs are eventually filled in. July WTI crude oil has begun to do exactly that, challenging the GAP area ($41.88-$37.33) with this morning’s intrasession high ($38.18). Given today’s negative EIA Crude Oil Stocks report, WTI may be in a position to grind higher as traditional summer seasonality kicks in.
EIA Reports Lagging Supply
Last week brought a major surprise for energy traders as the U.S. Energy Information Agency (EIA) reported a large week-over-week increase in supplies. This figure ran counterintuitive to late-Spring seasonality and brought COVID-19 demand fears back to the forefront. Now, it appears that supplies are coming back down to earth. Here’s a quick look at the weekly oil inventory cycle:
Event Actual Projected Previous
API Crude Oil Stocks -0.483M NA 8.731M
EIA Crude Oil Stocks -2.077M 3.038M 7.928M
Both the API and EIA reports came in negative this week, showing massive seven-day drops. These figures suggest that the demand for refined fuels and energy is growing. If falling supplies become a summertime trend, WTI values will be in a great position to extend the gains of late-spring.
WTI Tests The GAP Area
The weekly chart below is representative of July WTI at Tuesday’s close. It gives us a good look at the technicals ahead of this morning’s report-fueled test of the GAP.
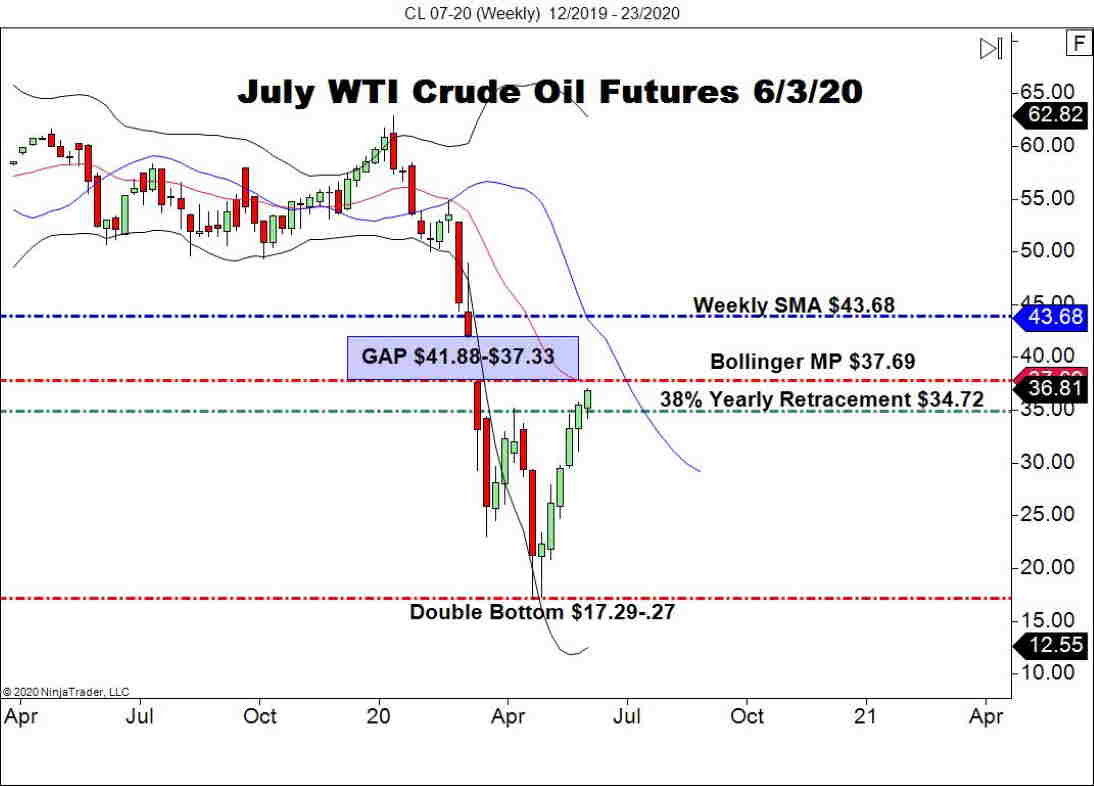
Overview: Right now, the key zone to watch in July WTI is the pricing GAP between $37.33 and $41.88. Today’s early bullish action tested this area; as we move into the future, look for prices to grind north and fill in the remainder of the GAP ($38.18-$41.88). While it may take some time to hit these levels, the energy bulls are in control of this market, driven by dwindling EIA supply figures.